DATASETS
To access the Datasets feature, from the navigation sidebar click DATA > Datasets.

The Datasets page shows the uploaded datasets available for analysis and testing. The data must be in CSV or in Excel format, each row represents an instance of the phenomenon to be analyzed, and each column contains the variables describing this phenomenon.

Upload new datasets
Datasets can be created from Excel or CSV files.
To add a dataset from a CSV file: 1. Click + DATASET on the upper right corner of the Datasets title bar. The dataset upload wizard appears.
If the active project does not contain any dataset, the wizard appears automatically.
- Click on tab CSV FILE

Upload data files by either clicking the upload icon to select a CSV file on your computer; or by dragging and dropping a CSV file to the upload icon.
Click on More Options to define how the file will be analyzed.

You can change the decimal delimiter to your preferred localized setting by selecting the correct delimiter from the list.
HyperCube supports a smart type detection feature that allows you to:
- Set a variable as discrete depending on how many modalities it has (you can define the threshold, the default value is 2)
- Set a variable as continuous if it has more than a specific percentage (%) of continuous values (you can define the threshold, the default value is 99%)
- Ignore a variable based on the percentage (%) of missing values it contains (you can define the threshold, the default value is 99%)
Click the UPLOAD button.
The new dataset is added to the list of datasets available in the active project. After the upload has finished, a data validation step automatically cleans the dataset, removing any corrupted lines.

To add a dataset from an Excel file: 1. Click + DATASET on the upper right corner of the Datasets title bar. The dataset upload wizard appears.
If the active project does not contain any dataset, the wizard appears automatically.
- Click on tab Excel FILE

Upload data files by either clicking the upload icon to select a CSV file on your computer; or by dragging and dropping a CSV file to the upload icon.
Click on More Options to define how the file will be analyzed.

You can change the decimal delimiter to your preferred localized setting by selecting the correct delimiter from the list.
HyperCube supports a smart type detection feature that allows you to:
- Selected sheet sets the sheet that will be used to create the dataset (default is the first sheet)
- Set a variable as discrete depending on how many modalities it has (you can define the threshold, the default value is 2)
- Set a variable as continuous if it has more than a specific percentage (%) of continuous values (you can define the threshold, the default value is 99%)
- Ignore a variable based on the percentage (%) of missing values it contains (you can define the threshold, the default value is 99%)
Click the UPLOAD button.
MANAGING DATASETS
To optimize the exploration, learning and prediction of the datasets, access the options are available in the dropdown menu by clicking the caret next to the dataset name:

This Dataset menu contains:
- View Data = opens a page which displays the complete list of data from the uploaded csv file (see below).
- View Variables = helps managing the variables of the dataset (see below).
- Discretization Management = opens a form to discretize the variables into bins.
- Rule Builder = opens a page that manages prediction rules.
- Sample Dataset = opens the Sample Dataset settings:
- Split ratio = defines which proportion of the original dataset is kept for the sample.
- Random State = defines what proportion of the data is shuffled.
- Keep variable proportions = by default this is set to no variable. If you select a variable, the number of rows in the sampled dataset will be based on the size of this variable.
- Sample dataset information = contains the name and description of the sampled dataset.
- Split Dataset = opens a settings wizard that defines the dataset sample:
- Train ratio = by default this is set to 0.7 and defines the reserved proportion of the original dataset to create the train dataset (e.g. 70%).
- Random state = defines what proportion of the data is shuffled.
- Train dataset information = contains the name and description of the train dataset.
- Test dataset information = contains the name and description of the test dataset.
- Set Default Dataset = changes the default dataset. This option is not visible if the dataset is the already the default project.
- Export = directly exports the dataset as a CSV file.
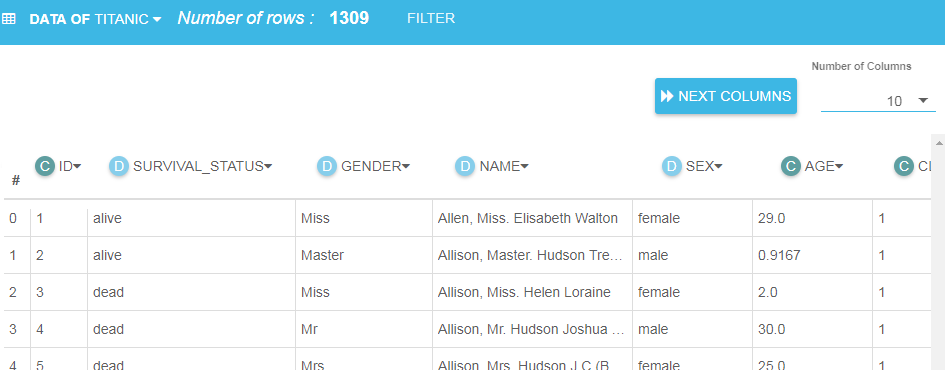
View Data
Use this page to view, sort and filter data.
Filter Data
To filter the displayed rows, open the filter cards by clicking on the Filter button on the Data titlebar. Three cards display:
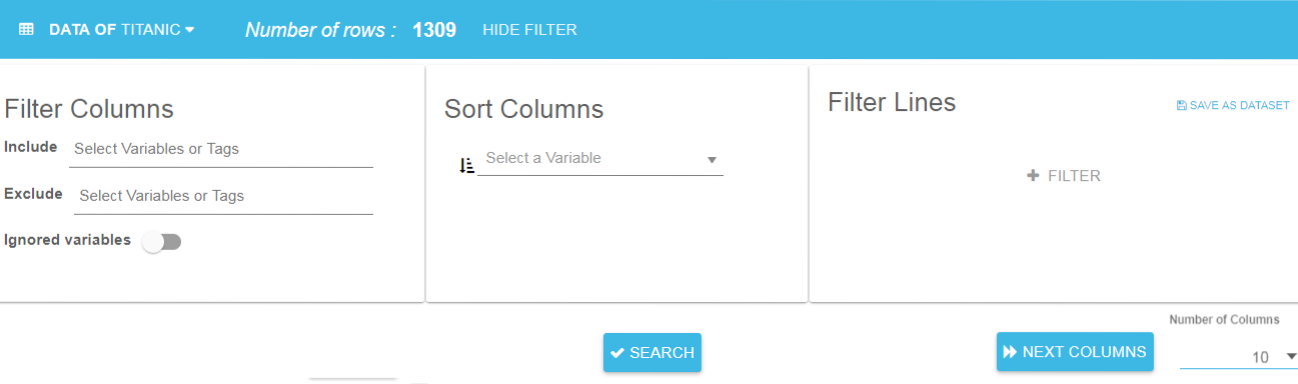
- Filter Columns: use to show or hide columns
- Sort Columns: use to sort the dataset columns
- Filter Lines: create dataset row filters
Click any variable column header to open a menu that allows you to include, exclude, hide or ignore the variable. This menu also shows information about the variable: graphic, tags, number of missing values. You can also change the number of significant digits for continuous variables.
Filter Columns
Filter Columns allows you to choose which variables to include and exclude.
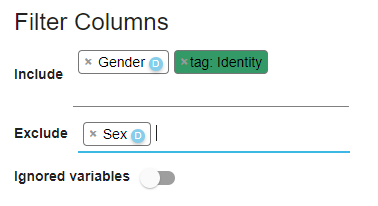
Only variables on the Include list appear in the grid. All the variables in the Hide list will be hidden. The Ignored variables switch allows you to show/hide any ignored variables (i.e. hidden by default). Variables can also be included or excluded using menu available in the the header of each variable column.
Sort Columns
Sort Columns allows you to select variables and sort the displayed data.
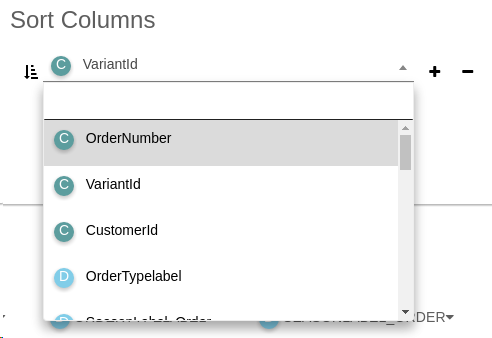
Each variable can be sorted in ascending or descending order. You can also sort variables directly from the menu available by clicking the variable column header.
Filter Lines
Filter Lines allows you to create, edit and delete filters.
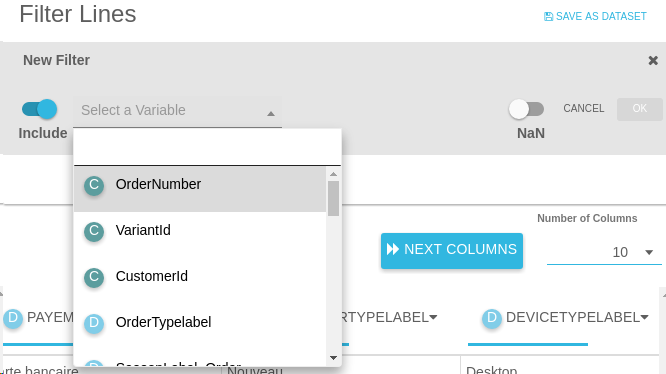
Filters have the following attributes:
- Include/Exclude: in the "include" ("exclude") mode, the filter shows (hides) only the rows that satisfy the your specified criteria.
- Variable: the variable the filter is applied to.
- Min and max: (displays only if the variable is continuous) the minimum and maximum of the filter.
- Modality: (displays only if the variable is discrete) the modalities of the filter.
- NaN: select NaN to include missing values in the filter.
Note: Missing values can only be excluded and not included. You can also create a filter on missing values by clicking on the red progress bar at the head of each variable columns. This progress bar also shows the rating of missing values in the column.
Save as dataset
The Save as dataset feature allows you to save the filtered dataset as a new single dataset.
Note: When geographical metatags are present in the dataset, a send to map button appears in the toolbar, allowing you to visualize this specific part of the data as a map.
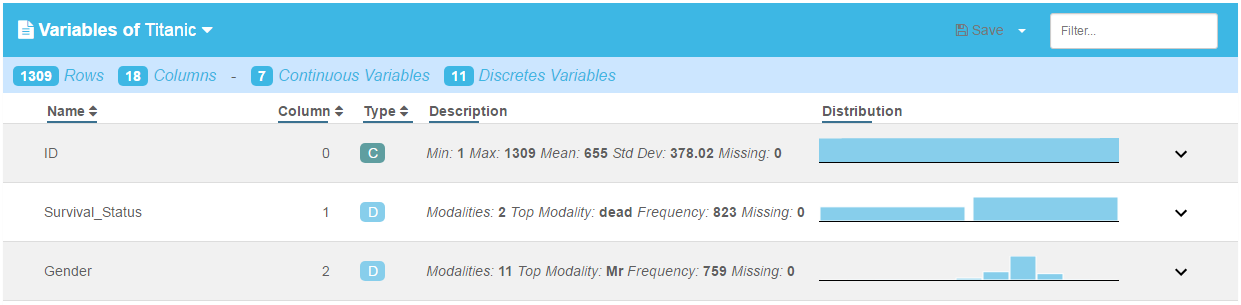
View Variables
Shows an overview and all the variable types (discrete vs continuous).
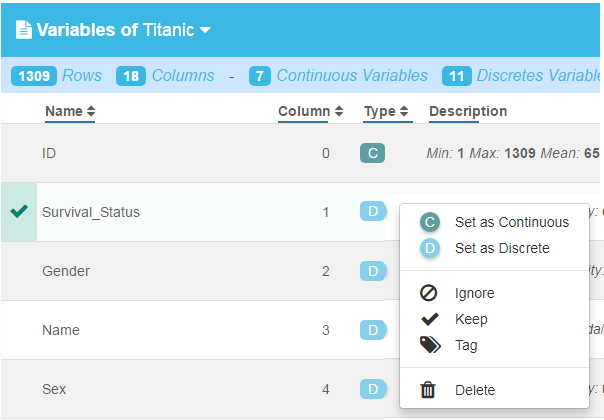
Ignore / modify variables types
This view also allows you to ignore some variables and to change the type of variables.
To select a variable, click on the row which becomes green and displays a check mark. green. You can select several variables by clicking on the required row or all variables by clicking on the header. To change a variable type or ignore it, click the icon in the Type column. A menu appears offering a list of actions.
IMPORTANT: To save your modifications press (Ctrl + S) while Hypercube is in the active window or click the Save icon on the upper right-hand corner of the Variables page.

Note: If you have changed variable type, the new dataset will not be available with Spark.
Filter
If there are too many variables to display, use the filter to display only the required variables. The filter is on the upper right of the Variables page.
Variable distribution
For each variable, the distribution can be displayed by clicking the down arrow on the right of each row. The display is different for continuous and discrete variables.
Continuous distribution
You can choose from two types of graph:
- Bar chart
- Box plot chart

- You can change the interval of the Bar chart by using the slider and the Number of bins field above the graph. Use the__Number of Bins__ field if you want to change how many bins are displayed.
- Click UPDATE to complete the action.

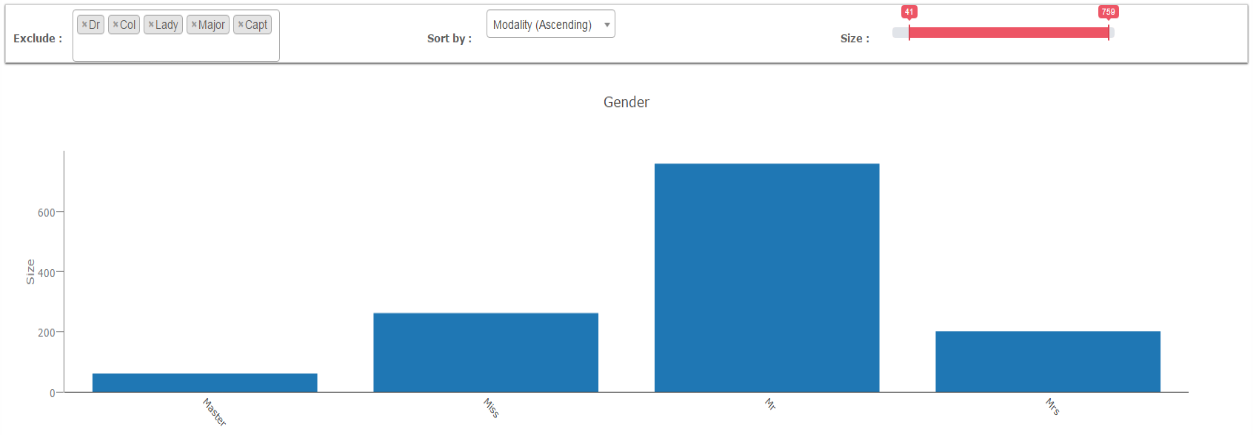
Discrete distribution

Discrete variables are represented with a bar chart, and a number of actions are available:
- Exclude a modality
- Sort the graph by the modality name or size
- Change the range of the displayed variable. For example, only display the variable with a size > 100.
Note: You can export graphs as a png file using this icon:
Metadata
Export Metadata
To download the dataset metadata in json format:
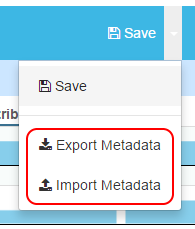
- On the variable page, click on the caret on the right-hand side of the Save icon, and select Export Metadata from the menu.
Import Metadata
You can also import custom metadata and apply it to a dataset:
On the variable page, click on the caret on the right-hand side of the Save button, and select Import Metadata from the menu.
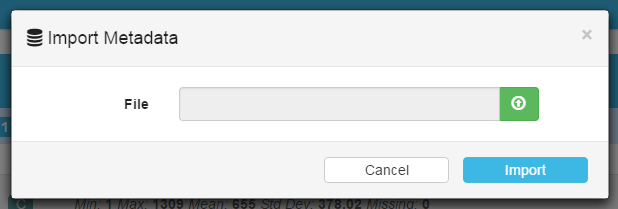
In the Import Metadata window ,click the green button and choose the new dataset.
Click the Import button to create the new dataset with custom metadata.
When importing metadata, several actions ara available:
- Ignore/Keep a variable
- Add tags
- Change the type of the variable