Release Notes v3.0
New
Data Visualization
- Square Bin
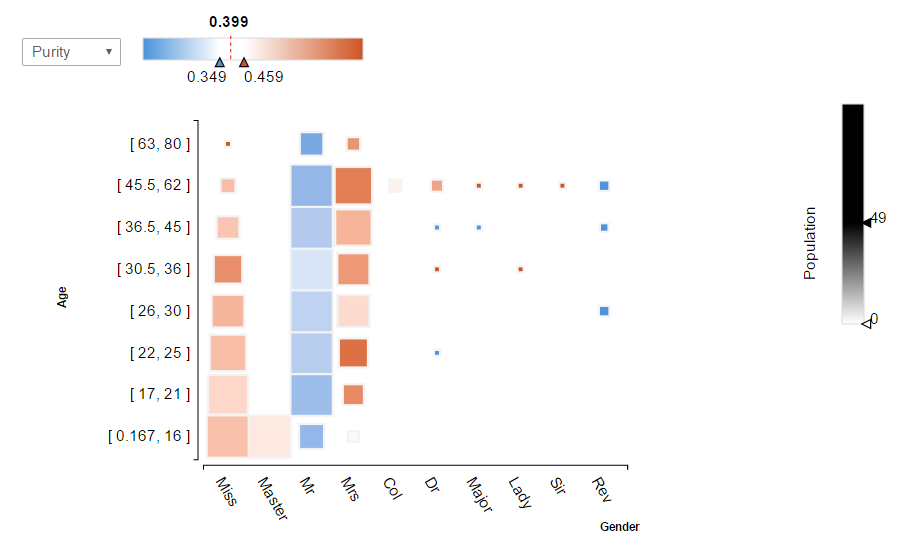
squareBin
- Tree Map
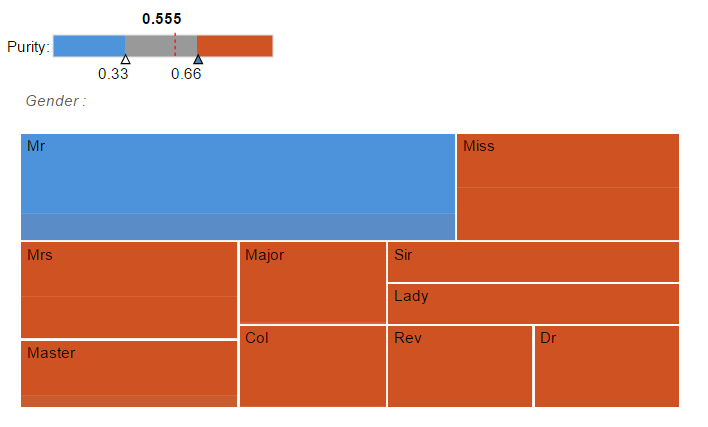
treeMap
- Sankey Chart
- Bar Chart
- Bubble Chart
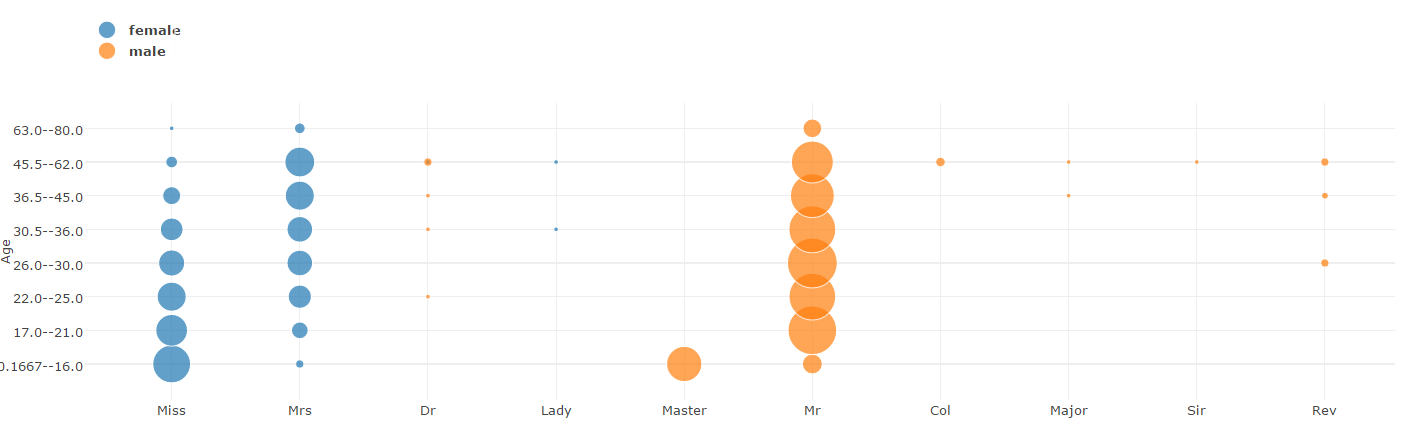
bubble
- Line Chart
- Stacked Bar
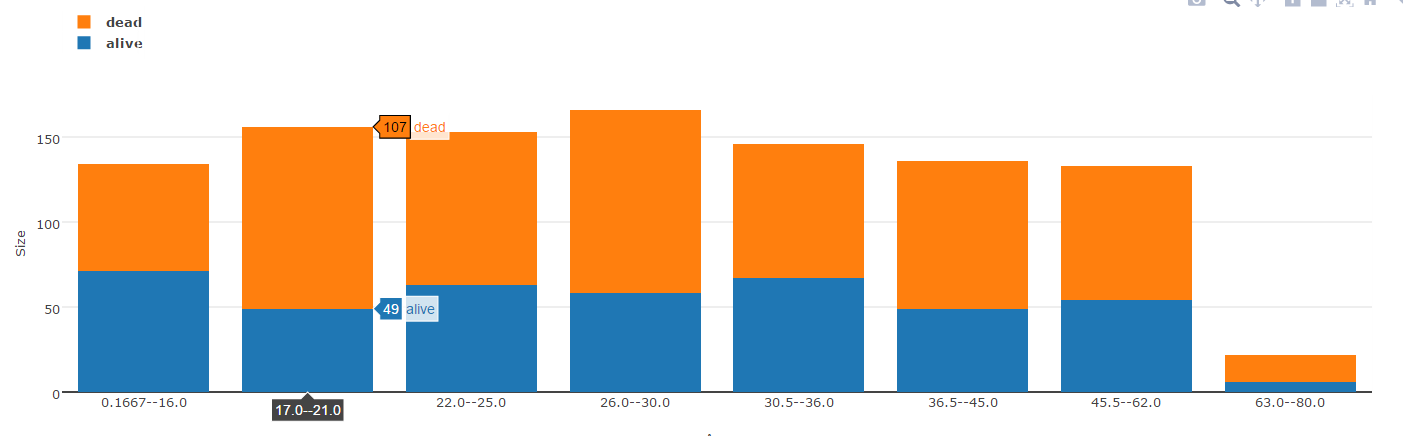
stackedBar
- DataViz in Notebook
- Bokeh DataViz Notebook Integration
- NetworkX HyperCube integration
- Correlation chart color intensity slider boundaries can be adjusted
- Hexa Bining
- Network Graph for Rules Intersection
Spark / Scala
We have implemented different features running on Spark Scala such as:
- Data Validation
- Simple Lift
- Mutual Information
- MLlib Integration
- Integration of Algo Distributed Random Forest and distributed gradient boost
Use Parquet file to load dataset
A new button display in the UI to let you choose to activate Spark

Spark
Python API
- New API
- Review, extended and enhanced Notebook integration
Improvements
Menu changes
- Data
- Datasets
- Targets
- Explore
- Correlation
- Dataviz
- X-ray
- Simple Lift
- Explain
- Rulesets
- Rule Builder
- Predict
- Models
- Advanced
- Notebooks
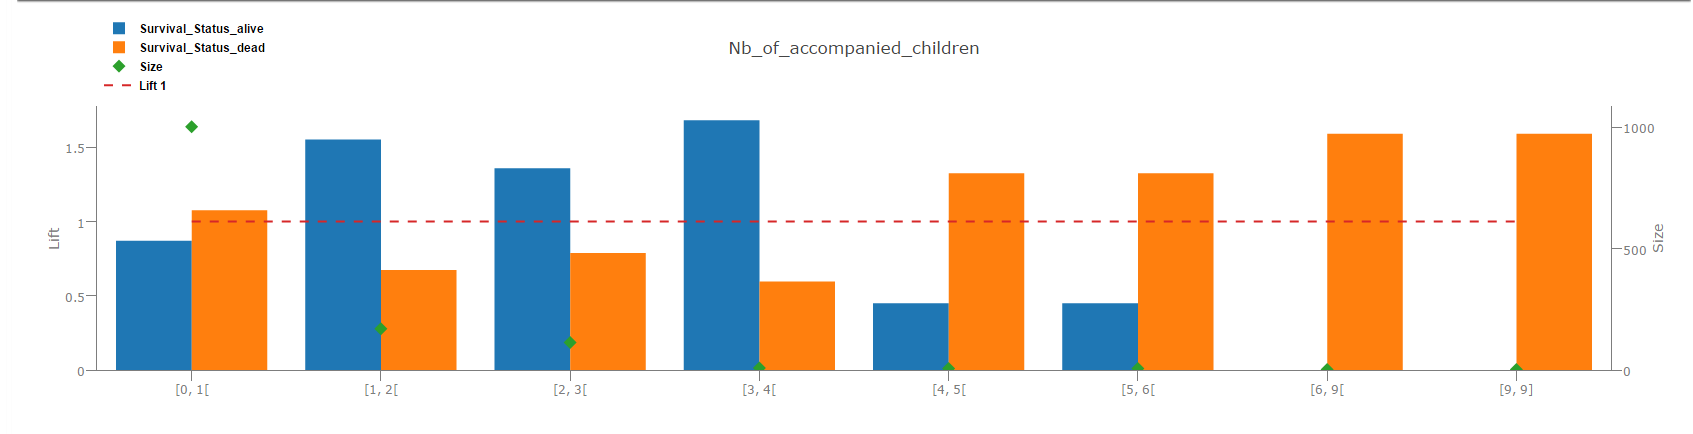
Distribution of variables
- Improvement of distribution of continuous variables
- Distribution of discrete variables display the top 50 modalities (and the sum of the others)
Discretization
- For each variable to quantize:
- The main change between v2.5 and v3.0 comes from the bin building.
- V2.5 uses "almost" a Quantilization whereas v3.0 uses in fact a Discretization. This modification is done to improve Hypercube algorithm, x-ray and mutual information performances.
- Intervals of bins are now non-overlapping
- For instance, in v3.0, intervals are include-exclude (eg: [1 - 3[ [3 - 5[ [5 - 7]) whereas in v2.5 intervals was include-include (eg: [1 - 3] [3.5 - 5.5] [6 - 8]). Note that the last interval stays include-include in both versions. With such contiguous boundaries, all the case values are considered.
- The main change between v2.5 and v3.0 comes from the bin building.
- For details:
- We construct each interval iteratively starting with the interval with lowest values to the one with highest values.
- We sort the values by increasing order and then the k-th interval:
- Starts with the first value > the upper bound of (k-1)-th interval,
- Ends with the first value for which the number of values equal or below (including the one from previous intervals) is superior to k*sizeDataset/countQuantiles.
Discretization
Query Ruleset
- Huge performance improvements for all requests
Algoritm and Prediction
- Export Python Model
- Define ideal rules to test the exhaustive rules
- Study intermediate pruning method
Ruleset Description
- This shows variables in the ruleset and their marginal contribution
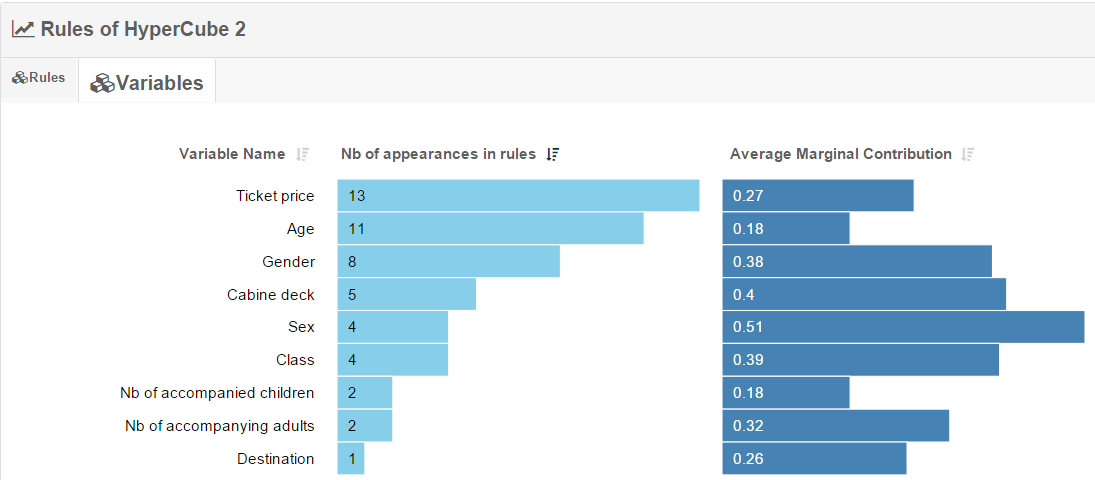
predictionDescription
- It is possible to sort on variable names or number of appearances in rules
- For discrete variables, the top 3 most used modalities are displayed
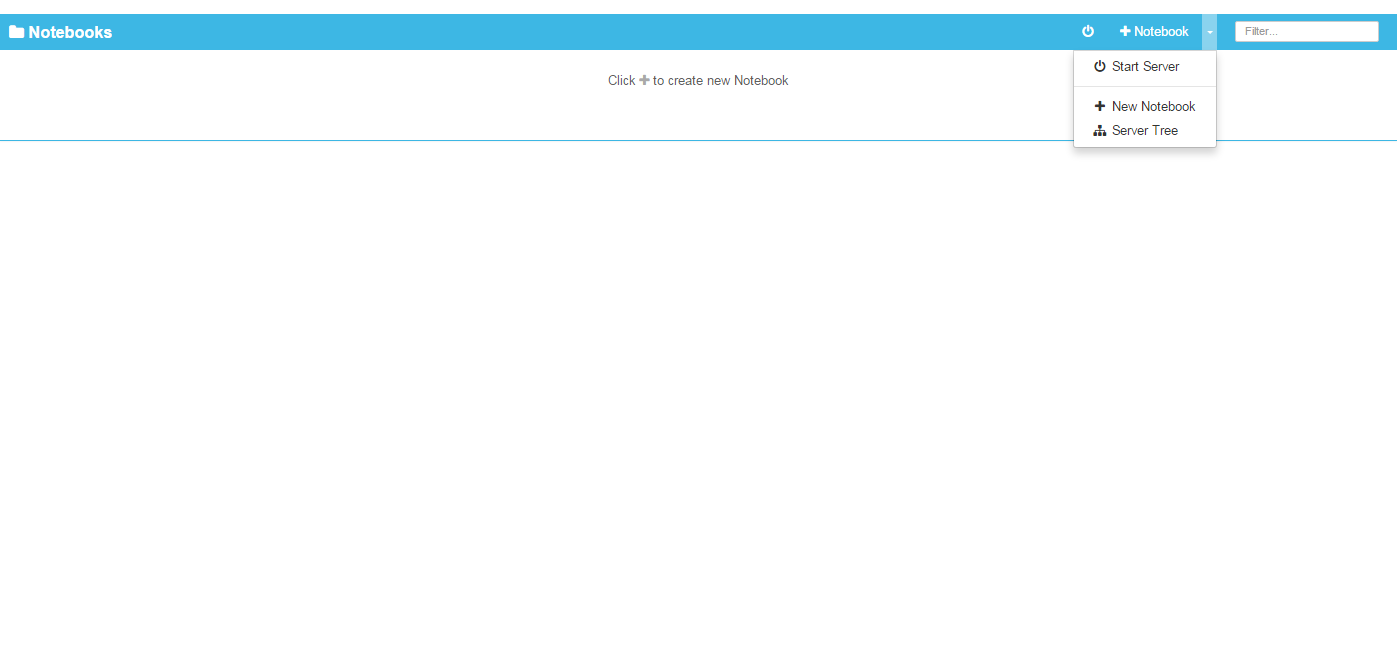
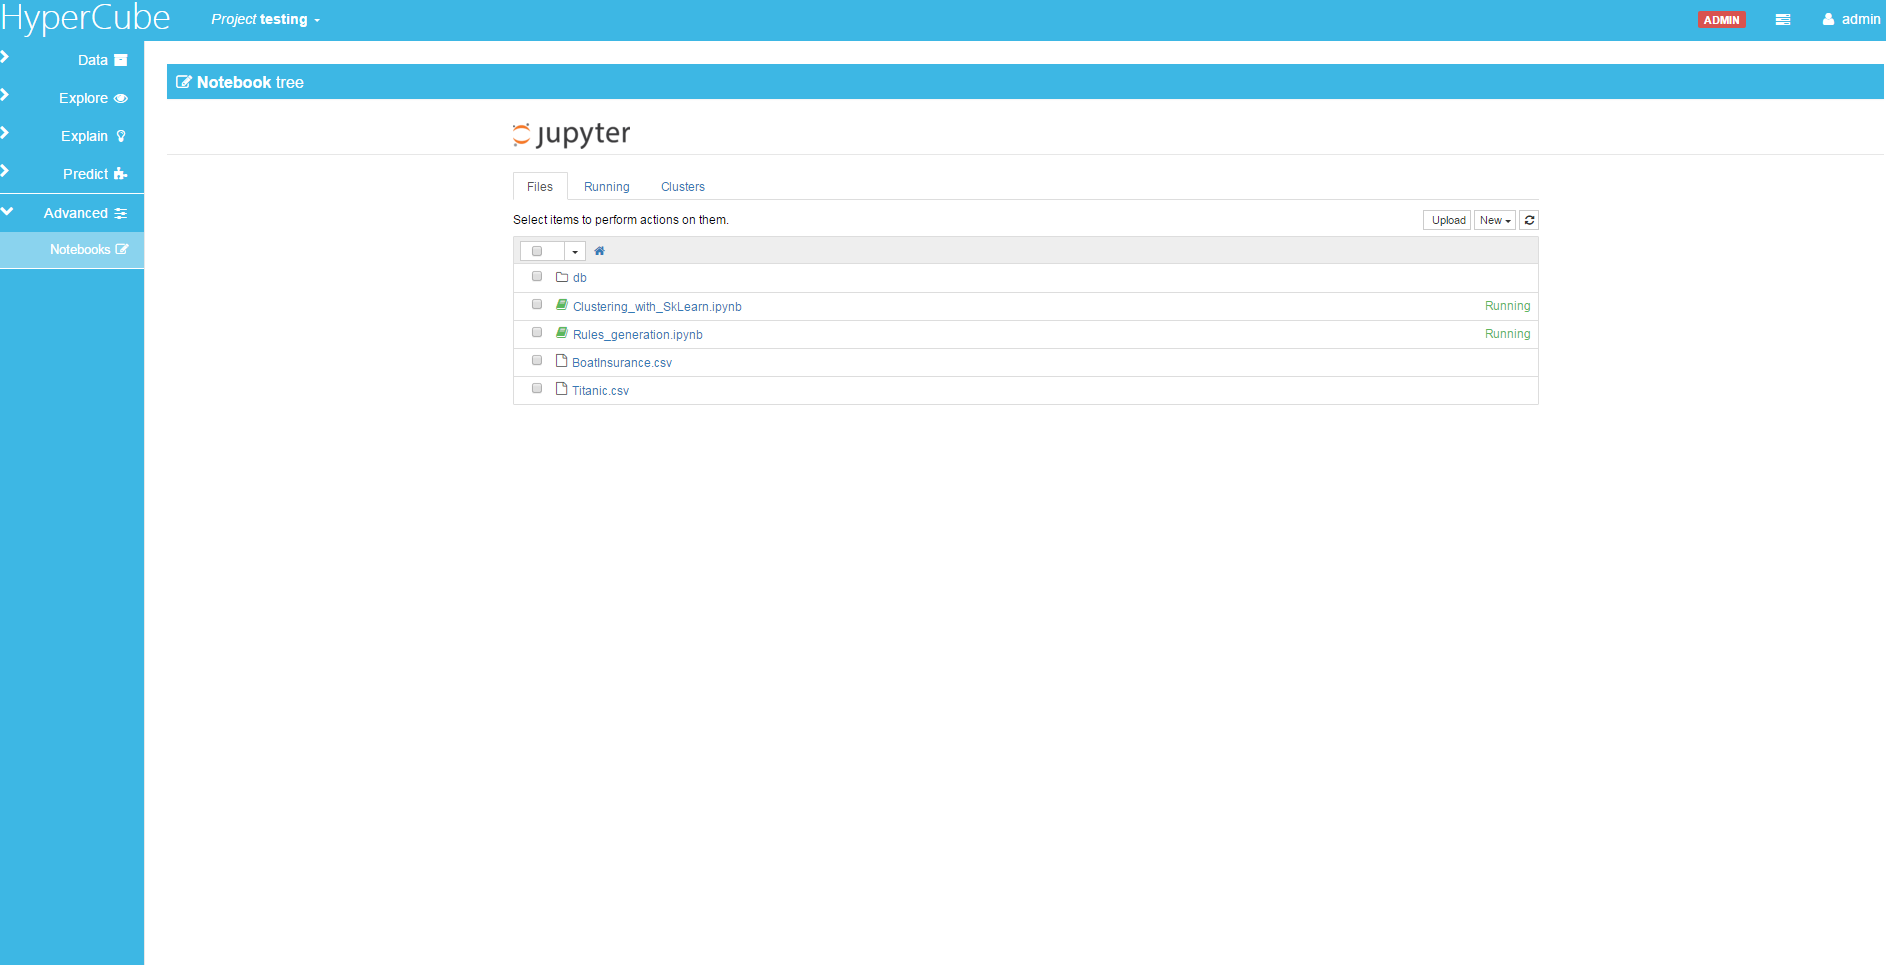
NoteBook
- Notebook displays a tree that lets you manage your files
notebook1
notebook222
- New Notebook samples are available:
- test_variables.ipynb
- test_xray.ipynb
- Project_management.ipynb
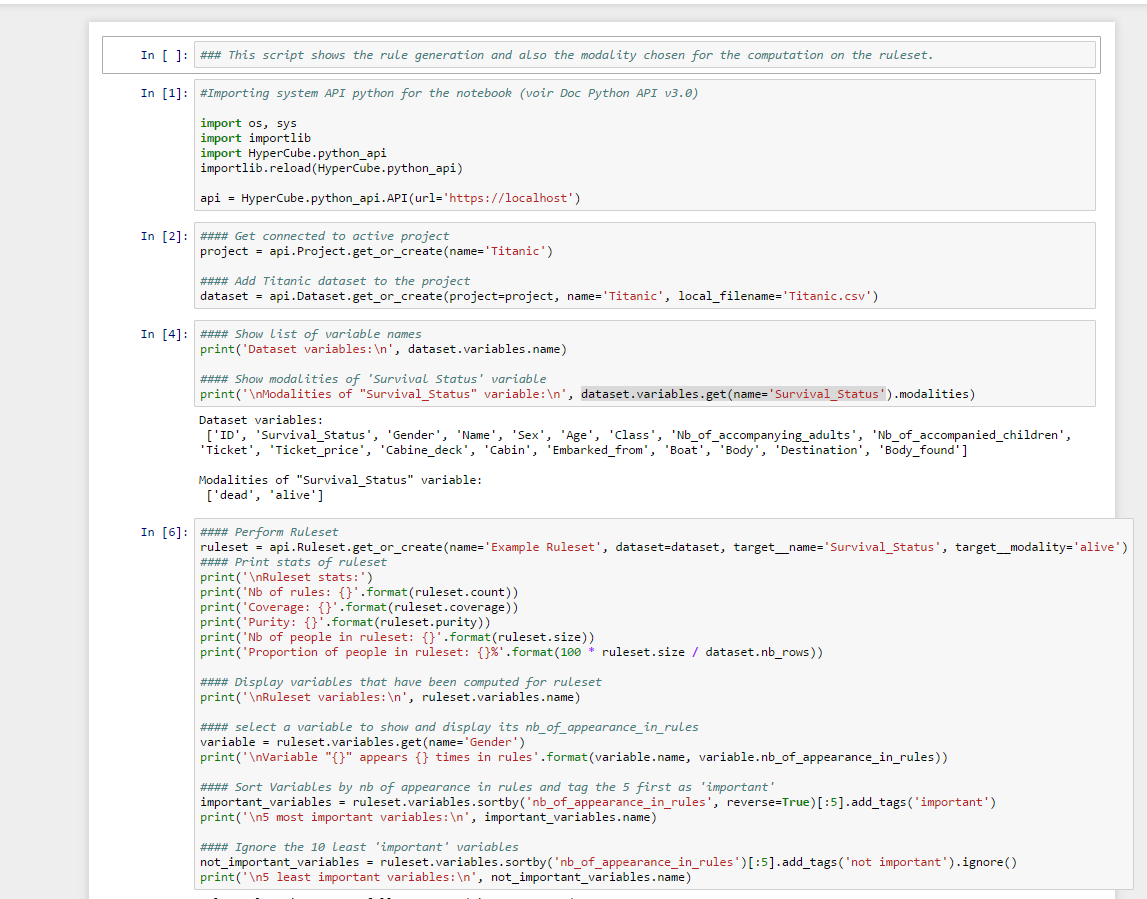
- Rules_generation.ipynb
notebook111
- New documentation for the Python API is available
Linux and MacOS
- Linux port on CentOS
- MacOS port for internal use